UCAT ANZ Scores and Percentiles: Official Statistics and Interpretation
Understand how UCAT ANZ scaled scores, deciles and percentiles work, compare official results from recent testing cycles, and decide what to do next for university applications and medical interview preparation.
Looking for an estimate from practice scores? This page explains official statistics and how to interpret them. For an indicative practice-score estimate, use NIE's separate UCAT practice score and percentile calculator.
What does a UCAT percentile mean?
Quick answer: A UCAT percentile shows the percentage of candidates whose total cognitive score was at or below a particular result. A score at the 90th percentile performed as well as or better than approximately 90% of the reference cohort.
UCAT ANZ reports scaled scores rather than raw marks. Each current cognitive subtest—Verbal Reasoning, Decision Making and Quantitative Reasoning—is scaled from 300 to 900. These three scores are added to produce a total cognitive score from 900 to 2700.
A percentile is a comparison with other candidates, not the percentage of questions answered correctly. Percentile thresholds can change between testing cycles because each cohort and score distribution is different.
Current UCAT ANZ statistics release status
Current testing cycle: UCAT ANZ advises that preliminary test statistics are normally released in late August, followed by total-score percentile information in September. Until the latest figures are published, previous results can provide context but cannot confirm a candidate's final percentile.
Always confirm the newest figures using the official UCAT ANZ test statistics. NIE reviews this page when new official statistics become available.
Official UCAT ANZ 2025 score statistics
The 2025 summary covers 16,950 candidates who tested from 1 July to 17 August 2025. A small number of candidates who tested outside that window were not included. Abstract Reasoning had been removed, so the total cognitive score was calculated from the three remaining cognitive subtests.
| Statistic | Verbal Reasoning | Decision Making | Quantitative Reasoning | Total cognitive | SJT |
|---|---|---|---|---|---|
| Mean | 620 | 642 | 679 | 1,941 | 586 |
| 1st quartile | 560 | 580 | 580 | 1,750 | 541 |
| Median | 610 | 650 | 660 | 1,930 | 593 |
| 3rd quartile | 670 | 710 | 780 | 2,130 | 638 |
| Decile / percentile | Verbal Reasoning | Decision Making | Quantitative Reasoning | Total cognitive | SJT |
|---|---|---|---|---|---|
| 1st / 10th | 520 | 530 | 530 | 1,610 | 489 |
| 2nd / 20th | 550 | 570 | 570 | 1,710 | 529 |
| 3rd / 30th | 570 | 590 | 600 | 1,780 | 554 |
| 4th / 40th | 600 | 620 | 630 | 1,850 | 575 |
| 5th / 50th | 610 | 650 | 660 | 1,930 | 593 |
| 6th / 60th | 630 | 670 | 690 | 2,000 | 611 |
| 7th / 70th | 660 | 690 | 730 | 2,090 | 629 |
| 8th / 80th | 680 | 720 | 820 | 2,190 | 649 |
| 9th / 90th | 730 | 750 | 880 | 2,310 | 672 |
Source: UCAT ANZ Consortium, Summary statistics for UCAT ANZ 2025. The first decile corresponds to the 10th percentile, the fifth decile to the median, and the ninth decile to the 90th percentile.
How to interpret your UCAT score and percentile
- Add the three cognitive section scores. For the current format, add Verbal Reasoning, Decision Making and Quantitative Reasoning to obtain a total from 900 to 2700.
- Compare the total with official thresholds. Use statistics from the same testing format and year wherever possible.
- Read the percentile as a cohort comparison. For example, the 90th percentile indicates performance at or above approximately 90% of the reference cohort.
- Check each university separately. A national percentile is not a universal interview cut-off.
- Consider the whole application. Academic results, applicant category, location, quotas, written applications and interviews may also influence selection.
- A percentile is not the percentage of questions answered correctly.
- Historical thresholds provide context but do not guarantee a future interview.
- Statistics from 2024 and earlier used four cognitive subtests and a total out of 3600, so those totals are not directly comparable with the current three-subtest total out of 2700.
- The Situational Judgement Test is reported separately and is not added to the cognitive total.
Historical UCAT ANZ score statistics
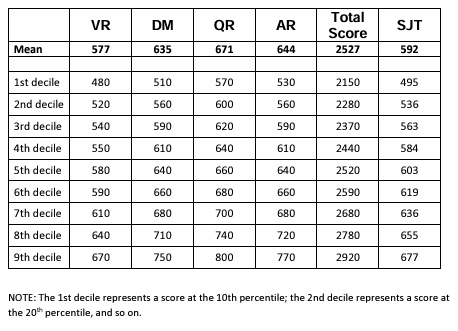
Use the archive below to understand longer-term patterns. Take care when comparing different years because the UCAT format and total-score scale changed after Abstract Reasoning was removed.
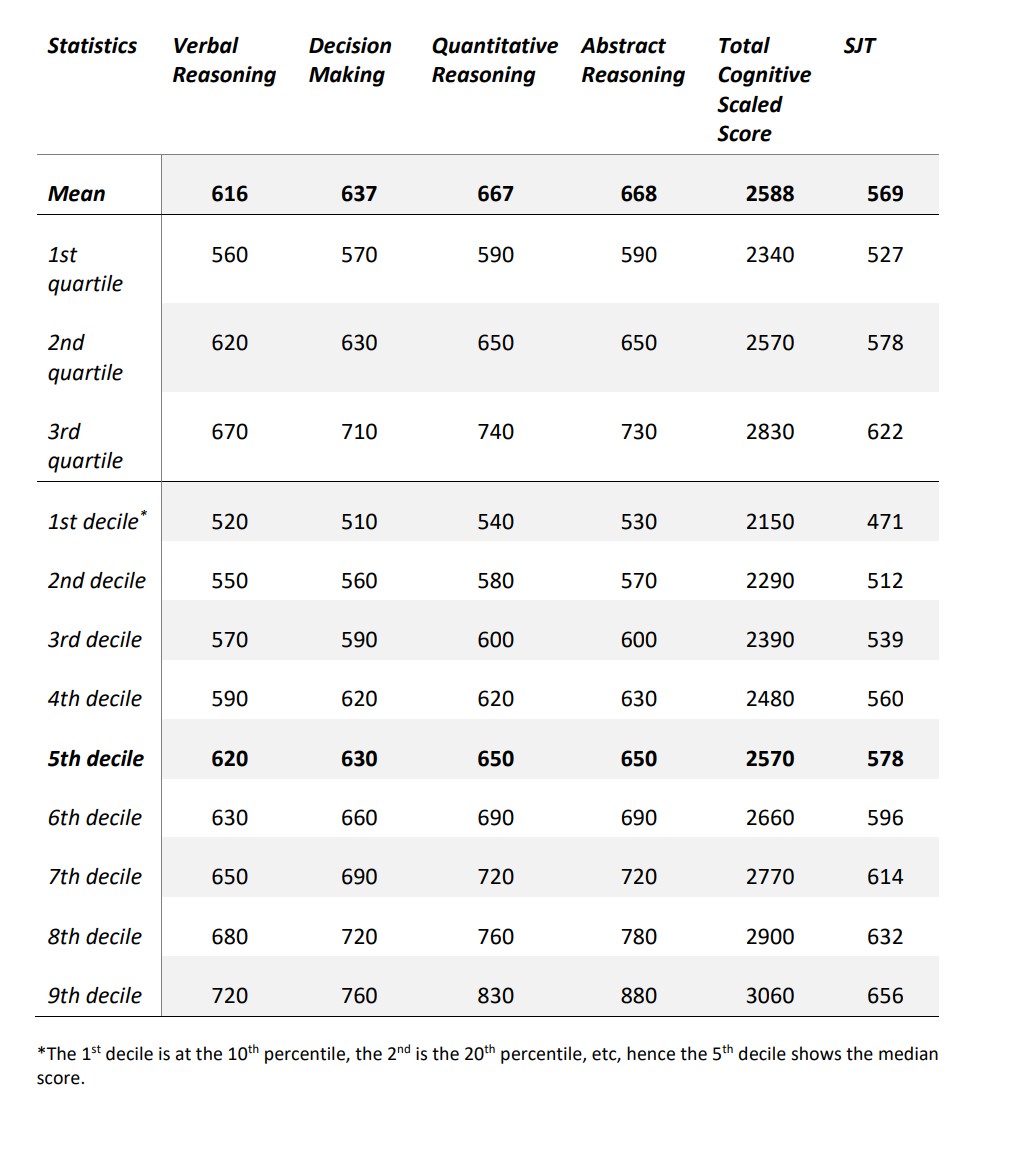
UCAT ANZ 2024 summary statistics
The 2024 summary covers 15,240 candidates who tested from 1 July to 17 August 2024. The test still contained four cognitive subtests, producing a total cognitive score from 1200 to 3600.
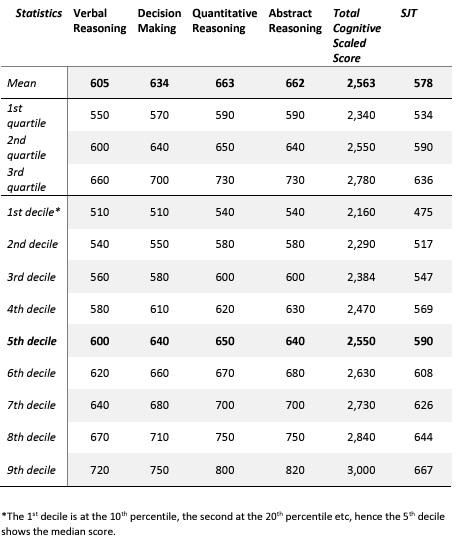
UCAT ANZ 2023 summary statistics
The 2023 summary covers 14,109 candidates who tested from 3 July to 21 August 2023. A small number of candidates who tested outside the main window were not included.
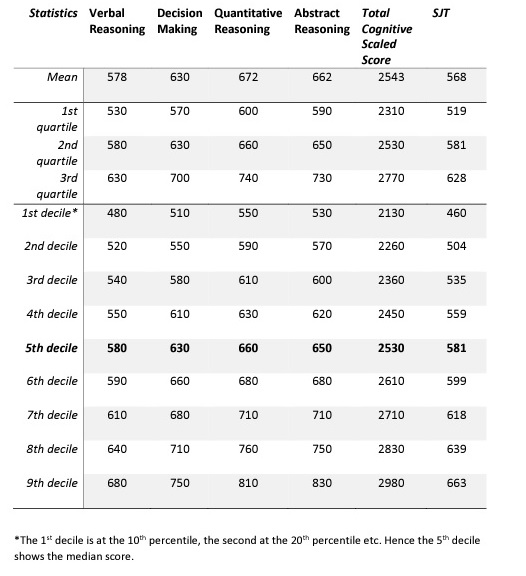
UCAT ANZ 2022 summary statistics
The 2022 final statistics cover 13,891 candidates who tested from 1 July to 12 August 2022. A further 18 candidates tested outside the main window and were not included in the analysis.
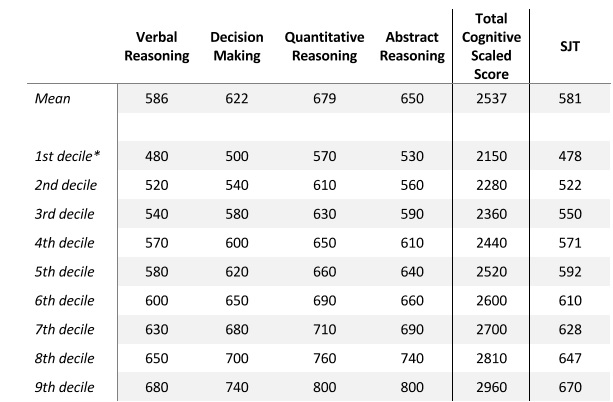
UCAT ANZ 2021 summary statistics
More than 14,000 candidates sat UCAT ANZ in 2021. Each of the four cognitive subtests was scaled from 300 to 900, producing a total cognitive score from 1200 to 3600.
UCAT ANZ 2020 summary statistics
The 2020 means and deciles were based on 14,092 candidates.
How universities use UCAT scores and percentiles
Universities publish their own admissions rules and may use UCAT ANZ differently. Some apply a threshold before considering applicants further; some combine UCAT with academic achievement; and others use it to rank candidates who are otherwise similarly placed.
Selection methods may also differ by applicant group. Rural, local, interstate, Indigenous, school-leaver, graduate and other categories can be assessed through different pathways or quotas. A previous interview threshold should therefore be treated as historical context rather than a promised future cut-off.
- Check the official admissions page for every university you are considering.
- Confirm whether the university considers the total score, individual subtests or both.
- Check whether ATAR, adjusted selection rank, written applications or applicant categories are combined with UCAT.
- Do not assume that a strong UCAT result guarantees an interview or admission.
Choose your next preparation step
Your best next step depends on whether you are still preparing for UCAT, interpreting a practice result, or moving towards applications and interviews.
Estimate a practice-score percentile
Use the dedicated practice calculator for an indicative comparison with previous score distributions.
Use the Practice CalculatorStart interview preparation early
Build communication, ethical reasoning and MMI response skills before interview invitations create a short preparation window.
Explore Head-Start TrainingJoin a medical interview workshop
Learn structured MMI and panel-interview strategies through guided teaching and realistic practice.
View Workshops and DatesGet personalised interview feedback
Work individually with an NIE trainer on response structure, delivery and university-specific preparation.
View One-on-One TrainingPrepare for rural and Indigenous health topics
Develop informed, respectful approaches to common rural, public and Indigenous health interview themes.
View Current Webinar OptionsCompare all interview services
Review workshops, packages, individual coaching and specialised medical and dental interview preparation.
See All Interview ServicesTurn your UCAT result into an application plan
A score is only one part of medical or dental entry. Start early enough to understand university requirements, strengthen interview performance and choose preparation suited to your pathway.
Receive the UCAT Score Trends Executive Summary
Enter your details to receive NIE's executive summary of multi-year UCAT ANZ score trends, key changes and practical insights for candidates.
Your details will be used to send the requested report and relevant news about medical and dental entry. You may unsubscribe at any time.
Frequently asked questions
Is a UCAT percentile the percentage of questions I answered correctly?
No. A percentile compares your scaled result with the performance of other candidates. Raw marks are converted to scaled scores, and the percentile describes your position within the relevant cohort.
Can I compare a current UCAT total directly with results from 2024 or earlier?
Not directly. Results from 2024 and earlier included four cognitive subtests and a total score from 1200 to 3600. The current format uses three cognitive subtests and a total from 900 to 2700.
Does a high UCAT percentile guarantee a medical interview?
No. Universities use different selection methods and may combine UCAT with academic results, applicant categories, written applications and other requirements. Thresholds may also change between admission cycles.
When are official UCAT ANZ percentiles released?
UCAT ANZ normally publishes preliminary statistics in late August and total-score percentile information in September. Candidates should check the official test-statistics page for the latest release.
Where can I estimate a percentile from practice scores?
Use NIE's dedicated UCAT practice score and percentile calculator. Its result is an educational estimate rather than an official percentile or university cut-off.
Official sources and review policy
The scoring explanations and current official figures on this page are based on the UCAT ANZ scoring guidance and UCAT ANZ test statistics.
Review policy: NIE reviews this guide when new UCAT ANZ statistics or material scoring changes are published. University admissions requirements should always be checked directly with the relevant institution.
Disclaimer: This information is educational guidance. NIE is not affiliated with or endorsed by the UCAT ANZ Consortium or any university. Historical scores and percentiles do not guarantee an interview or admission.